Before you can add a K-Report to a Dashlet on your dashboard, you will need to publish it.
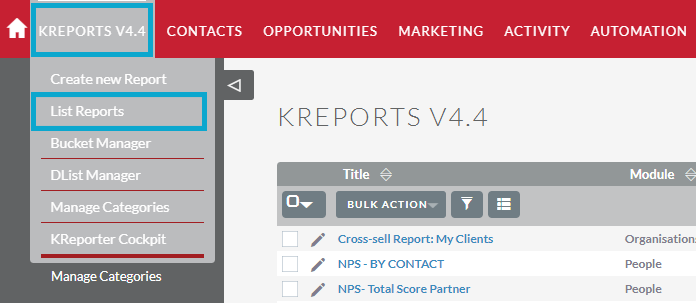
Go to K-Reports → List Reports (you may need to hover over the All menu):
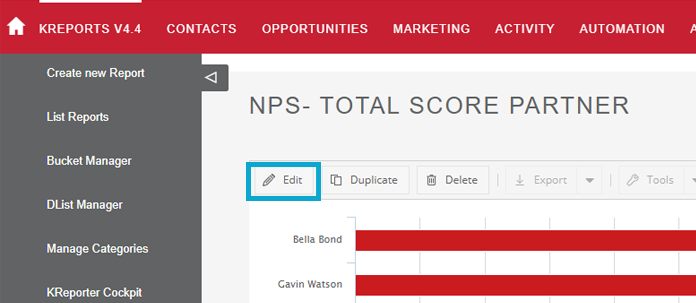
Open the report you want to add a Dashlet for, and click Edit:
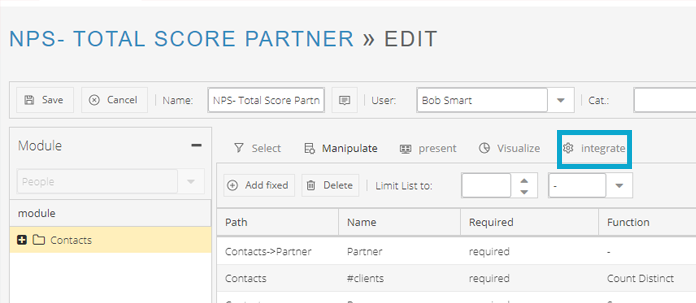
Then go to the Integrate tab:
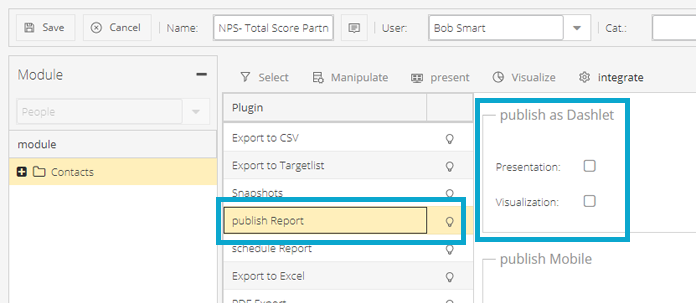
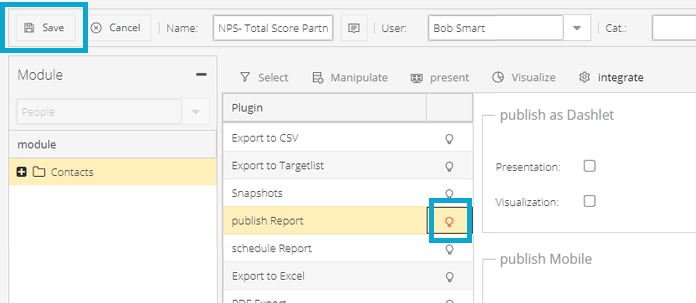
Click on Publish Report and tick the box you would like to have as a Dashlet, under the section Publish as Dashlet.
If you have graphs in your report that you want on your dashboard, you need to tick Visualisation.
If you want to see the content (e.g. rows & columns of data) of the report, you need to tick Presentation.
If you would like both the graph and the data available, tick both boxes. You can ignore the options below this, only use the options highlighted below:
Once you’ve ticked the relevant boxes, click on the lightbulb next to Publish Report on the left. Then hit Save.
Adding a Dashlet to your Dashboard
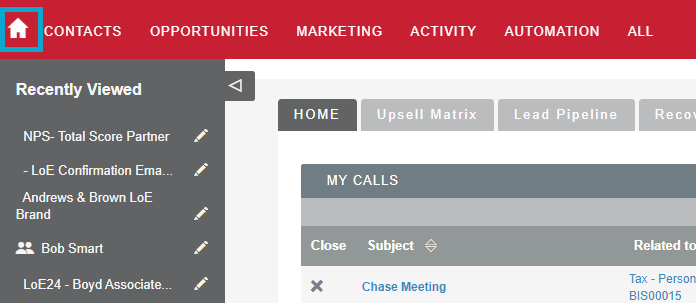
Now you need to go to your dashboard, click the Home button
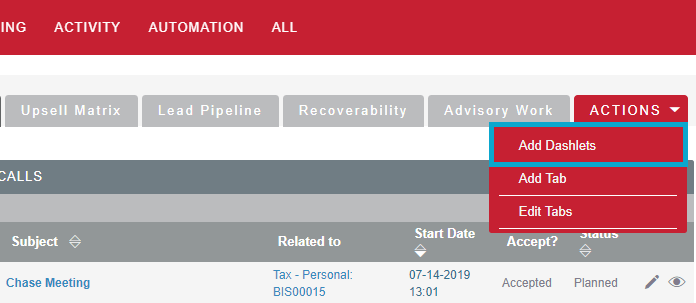
On the Actions menu, select Add Dashlet:
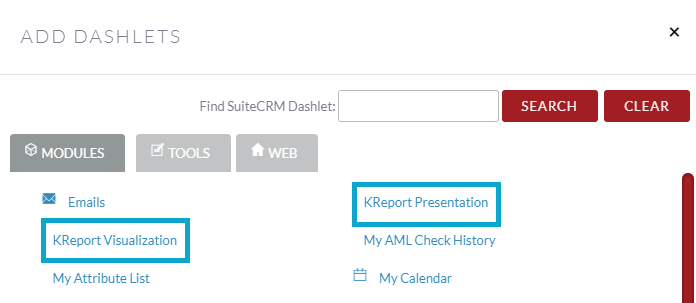
A pop-up menu will now appear, if you would like to see a presentation of the data then click KReport Presentation, if you would like to see the graphs from your report, click KReport Visualisation.
Note: You will need to add graphs to the report before you can view them in the Dashlet)
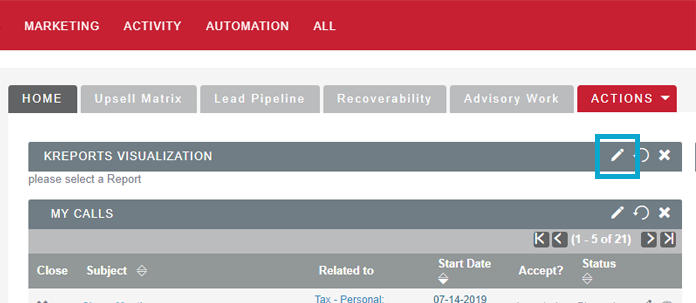
Once you’ve picked which one you’d like, close the window. A new Dashlet will have been added to your homepage, which will look a bit like this >
You now need to select a report for the dashlet to display. Click the little pen icon, as shown above.
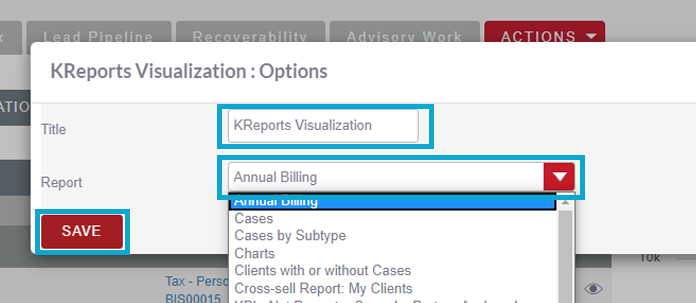
A pop-up will appear, give your Dashlet a name and chose your report from the drop-down list.
Name your Dashlet and pick the corresponding report from the drop down list.
Then hit Save and you’re done!
Table of Contents
We use cookies to assess how people are using our website, only necessary cookies are enabled. Cookie settingsACCEPTREJECT
Cookie Policy
Privacy Overview
This website uses cookies to improve your experience while you navigate through the website. Out of these cookies, the cookies that are categorized as necessary are stored on your browser as they are essential for the working of basic functionalities of the website. We also use third-party cookies that help us analyze and understand how you use this website. These cookies will be stored in your browser only with your consent. You also have the option to opt-out of these cookies. But opting out of some of these cookies may have an effect on your browsing experience.
Necessary cookies are absolutely essential for the website to function properly. This category only includes cookies that ensures basic functionalities and security features of the website. These cookies do not store any personal information.
Any cookies that may not be particularly necessary for the website to function and is used specifically to collect user personal data via analytics, ads, other embedded contents are termed as non-necessary cookies. It is mandatory to procure user consent prior to running these cookies on your website.
Functional cookies help to perform certain functionalities like sharing the content of the website on social media platforms, collect feedbacks, and other third-party features.
Performance cookies are used to understand and analyze the key performance indexes of the website which helps in delivering a better user experience for the visitors.
Analytical cookies are used to understand how visitors interact with the website. These cookies help provide information on metrics the number of visitors, bounce rate, traffic source, etc.
Advertisement cookies are used to provide visitors with relevant ads and marketing campaigns. These cookies track visitors across websites and collect information to provide customized ads.