How Can We Help?
KReports Overview
This guide is to briefly explain the KReports functionality of FibreCRM.
This is an important cornerstone in the value of using CRM. Here you will be able to access dozens of reports on a variety of different data sets for sales pipelines, business development, client engagement, billing & other practice activity.
Report tables and visualisation graphs can also be pulled through from the Reporting Module to display on Dashboards via Dashlets. For more information on Dashboards, please refer to the Dashboard Overview user guide.
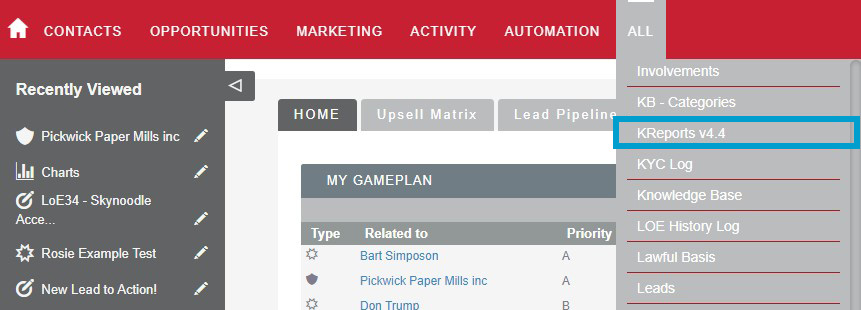
To access the Reporting Module, use the navigation menu and select the KREPORTS option.
To create a Task you do so by first navigating to the All tab on the Navigation Menu and selecting Tasks.
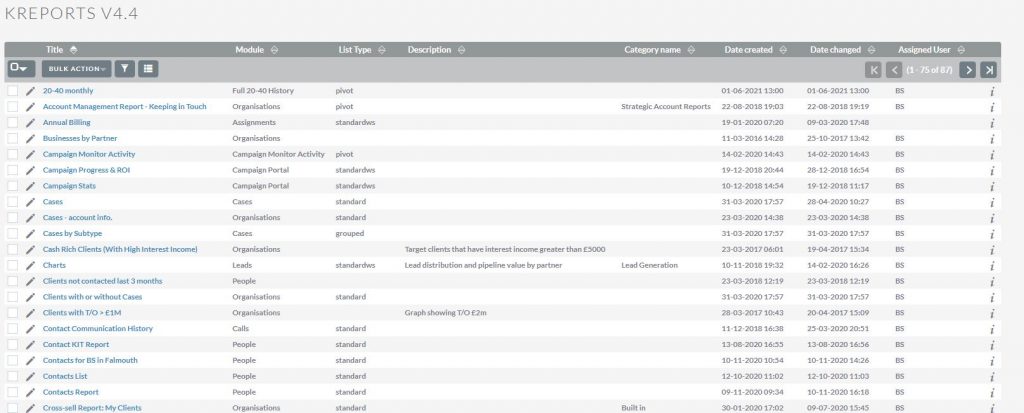
You will notice that there are two methods of viewing reports. One is the List Reports view where you can view all reports created in your CRM.
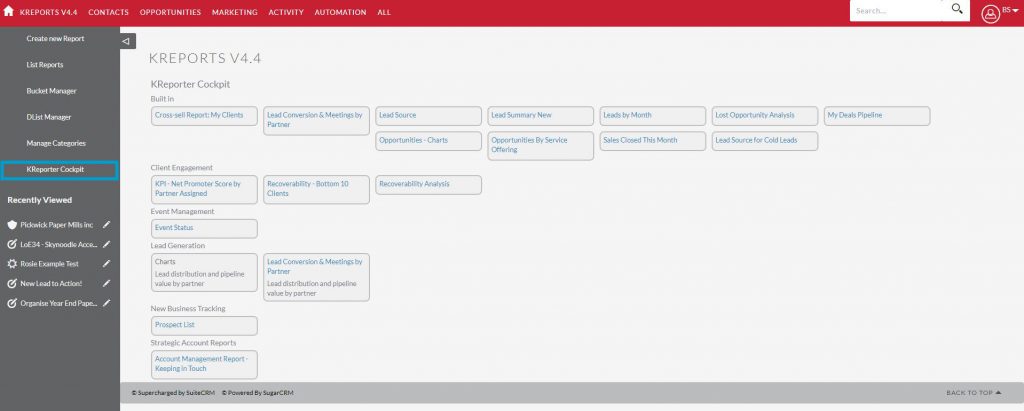
The primary screen for a user in the Reporting Module is the KReporter Cockpit. Think of this as similar to a Dashboard in that you can add frequently used reports to your cockpit screen. For example, Goals vs Actual Compared to Previous Year or Distribution of Opportunities by Industry Solutions Group.
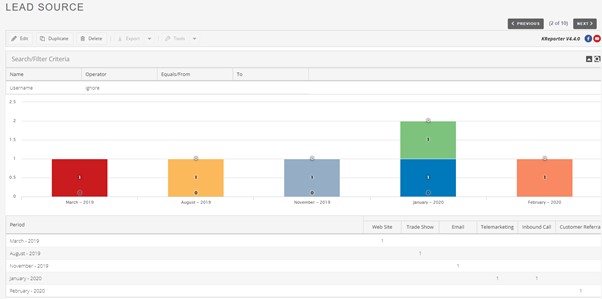
This is an example of a typical report called generated in CRM for users to refer to.
In this example, the report is a count of all your leads grouped by month pivoted by lead source. This data is limited to the previous year to date. The report is filterable by assigned user.
.